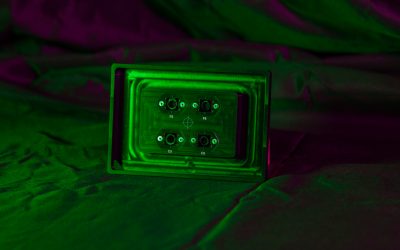
The Argo-POWERHM offers many ways to monitor the illumination power of fluorescence microscopes. With the integration in Daybook Analysis, live illumination can be displayed in no more than a few steps. Here’s a short tutorial on how to get the most out of your device.
1. Establish the long-term stability of illumination power
One may have to carry a long study that requires illuminating a sample for a long-term period, for example, 10 minutes, 1 hour, or 1 night. It might be good to establish the long-term stability of illumination power beforehand.
Verifying there are no fluctuations over time allows one to get rid of the uncertainty of a bad measure and waste of microscope time.
Step-by-step
In Daybook, you can use the time-lapse feature to visualize on a graph the possible power fluctuations over long periods of time.
1) Set-Up Daybook software
- Connect the Argo-POWERHM device to the computer.
- Open Daybook Analysis software.
- A settings panel will open. Select the Argo-POWERHM version of Daybook.
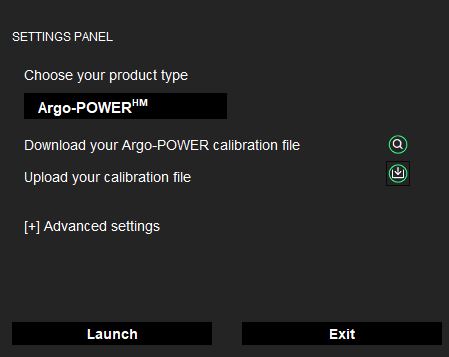
- Download the calibration file corresponding to the serial number of your product, through this page.
- Upload the corresponding calibration file (ending in .argo).
2) Run the time-lapse measurement in Daybook
- Click on the “Power Meter” menu.
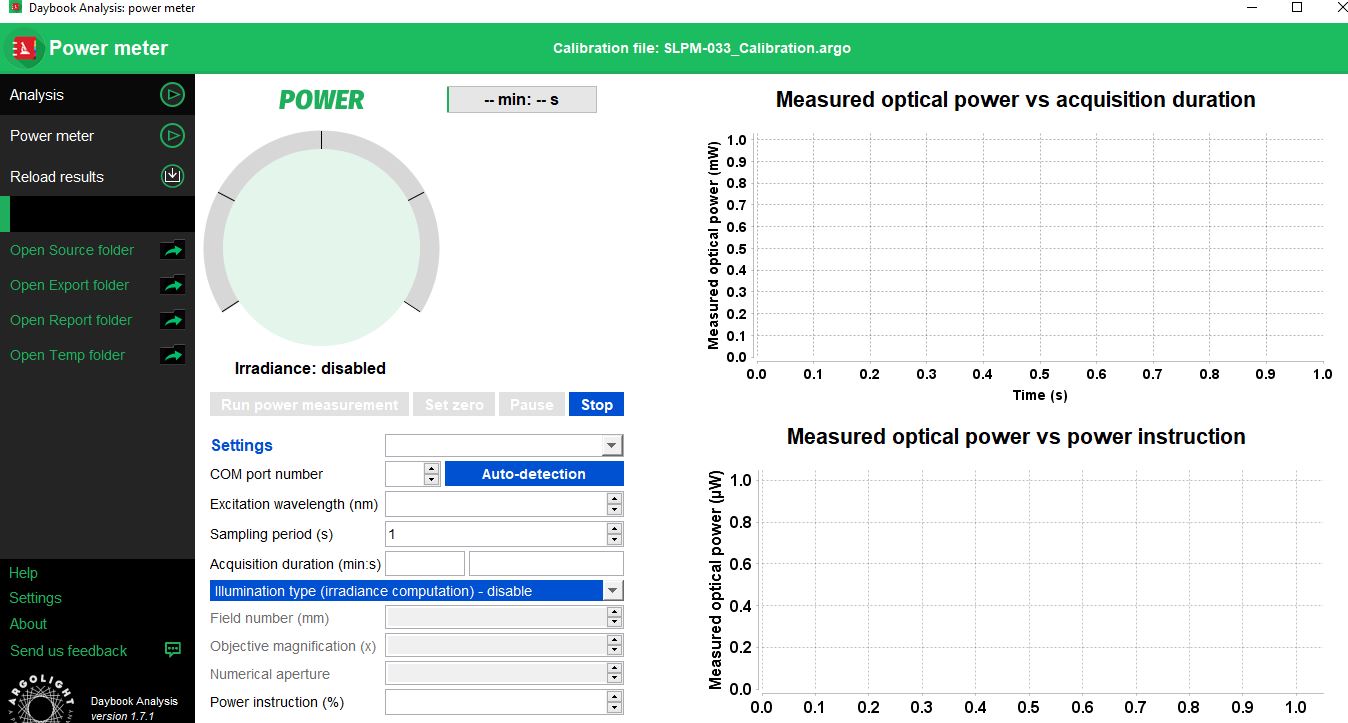
- Enter the light source wavelength, the acquisition duration (in minutes) and the sampling period (in seconds).
- Click on the “Run Power measurement” button.
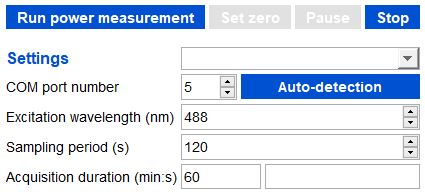
Example of acquisition set to a 60min duration, with 1 measurement every 2 minutes (sampling period: 120s), for an excitation wavelength of 488 nm.
2. Take the steps to prevent phototoxicity
It is rare to know how much illumination power is actually sent on to the sample, as it is displayed in % unit rather than absolute unit.
Phototoxicity is likely to happen when you cannot quantify how much power you shine on a sample. For instance, 25% of illumination power on a microscope Alpha does not equal 25% illumination power on microscope Beta.
For the sake of reproducing experimental images and data, independently from the used imaging system, it is important to know how much light a biological sample receives on a given surface. This requires the calculation of the surface power density, i.e. the irradiance.
The irradiance (given in W.cm²), is the ratio of the optical power (in W, watt) divided by the illuminated surface (in cm2).
The optical power can be measured with a power meter at the focal plane of the objective.
The surface, however, is difficult to measure. It can be calculated, depending on the microscope illumination mode. Note that the irradiance for point-scanning microscopes can be several orders of magnitude higher than that for wide-field microscopes.
We recommend this article by the MPI in Dresden, Germany, and Harvard Medical School, USA:
Phototoxicity in live fluorescence microscopy, and how to avoid it. [1]
Step-by-step – Live irradiance calculation
Daybook can compute a theoretical calculation of the surface to provide an estimated irradiance. Formulas used can be found on page 31 of the Argo-POWER user guide.
- In the “Power Meter” menu, select the type of illumination (wide-field or confocal illumination), and fill out the associated parameters.
- Daybook provides the irradiance in live, based on the measured optical power and the formula described in the user guide.
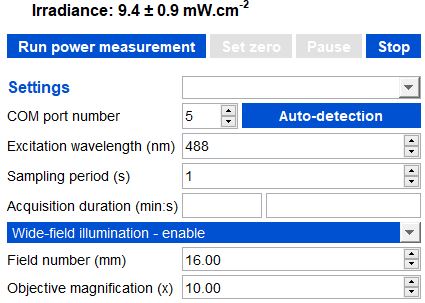
Example of irradiance calculation (top of the image) for a wide-field illumination, with a field number of 16mm and a 10x objective.
3. Troubleshooting and Quality Control
In most of the acquisition software of fluorescence microscopes, the adjustment of the light sources’ optical power is performed in fractions of the full power (in %) and not in optical power units (in W). The measurement of the evolution of the optical power in Watts versus the power instruction in % should be regularly carried out to check the linearity of the evolution, the absolute power values, or the compliance with the specifications after a system installation or maintenance.
Step-by-step – Assess the linearity
Daybook can plot a curve with the corresponding values of the different power instructions, for one or several wavelengths.
- In the “Power Meter” menu, enter the power instruction you want to verify (for instance, 25%). Report the same value within your acquisition software.
- Once the sensor is illuminated, click on “Run power measurement”. Let it run for a few seconds, and click on “Add values”. A row will appear within the table. A dot will appear on the side graph.
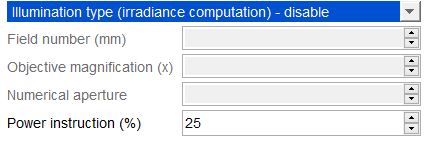
- Once the sensor is illuminated, click on “Run power measurement”. Let it run for a few seconds, and click on “Add values”. A row will appear within the table. A dot will appear on the side graph.
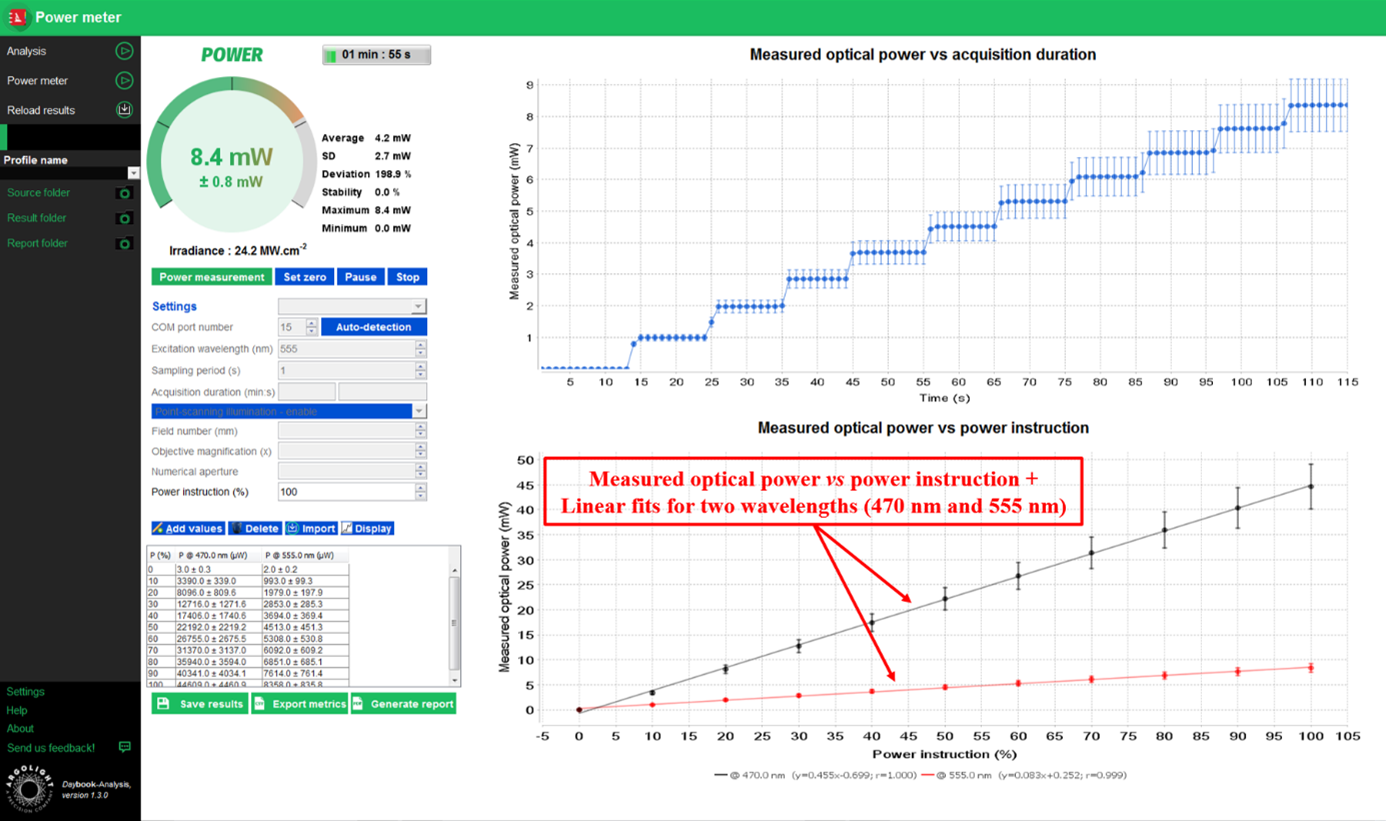
Example of measured optical power versus power instruction for two light sources.
““Comparison of fluorescence intensities between images requires measurements of the illumination power and stability of the excitation light source. [This work group] aims at establishing a recommended protocol for measuring the stability of a light source during both short- and long-term image acquisition sessions using calibrated external power sensors.” [2]
4. Assess your whole illumination path
The Argo-POWERHM allows users to verify there is no major issue over the illumination path. It’s usually useful when doubt arises from the use of a microscope, or before carrying important experiments.

Using the sensor head, one can measure the signal emitted by the light source, through the different steps described above.
Once it has been secured there are no problems on the illumination path, it is possible to use the Argolight patterns to verify the detection path.
The light theoretically emitted by the patterns is perfectly known. So if one finds a different result provided by the detector, it is a sign to investigate further or call maintenance.
After both illumination and detection paths are verified, experiments, where intensity is important, can be carried out safely.
Off you go!
It’s as simple as that. For more details on other cool ways to operate your Argo-POWERHM, reach out to the Support Team and we’ll be happy to assist!
Sources:
[1] “Phototoxicity in live fluorescence microscopy, and how to avoid it.” Jaroslav Icha, Michael Weber, Jennifer C Waters, Caren Norden. Bioessays; 39(8) DOI 10.1002/bies.201700003 (August 2017)
https://publications.mpi-cbg.de/Icha_2017_6914.pdf
[2] “QUAREP-LiMi: A community-driven initiative to establish guidelines for quality assessment and reproducibility for instruments and images in light microscopy” (January 2021)
https://arxiv.org/abs/2101.09153
Related terms: illumination power, live irradiance, power fluctuations, power-meter, power for biological applications, power instructions
Header photo by Good Good Good on Unsplash
User case: Kyoto University x Argolight – Fluorescent proteins observation
Matsuda Lab, Graduate School of Biostudies/Graduate School of Medicine, Kyoto University Introducing Argolight slides - A New Quality Control...
Quality control of HCS-HTS fluorescence imaging systems
In the landscape of high-content screening (HCS) and high-throughput screening (HTS) fluorescence imaging systems, precision and reliability take...
Precision Partners: Innopsys and Argolight on the InnoQuant Slide Scanners
In the intricate realm of pathology, drug discovery, and advanced research in brain function, cancer, and stem cells, the role of slide scanners has...

