Ever heard “My sample looks less intense. There must be something wrong with your microscope.”? It is a recurring topic, especially in Imaging Core Facilities, where users come with their own samples and want to compare results.
It might induce a doubt on the intensity response of a microscope. Using Argolight slides, one can easily verify the intensity response of the system.

1. Why does the intensity response matter?
The intensity measurement in images is a direct way to measure the accumulation of dye in parasites stained with fluorescent markers, to detect the central region of cell nuclei (peak intensity), to calculate the ratio of nuclear versus cytoplasm intensity for each cell detected… And much more.
When this kind of measurement is performed over time, for instance, to monitor the evolution in a sample or measuring variations between several samples, it is important to ensure that the intensity response of the imaging system has not fluctuated. By intensity response, we mean the signal measured by the detector, coming from the photon flux emitted by a fluorescent sample, which is excited with a light source.
By definition, the intensity response of a fluorescence microscope depends on all the components of a fluorescence microscope, from the light source to the detector, via the sample. It is influenced by many factors, in particular: the light source (power, wavelength, stability…), the sample (quantum efficiency, stability…), and the detector (sensitivity detection and saturation limits, stability…). Because all these factors can change over time, the overall intensity response may change as well, making it an important performance parameter to assess.
2. Discriminate if it comes from the sample or the microscope
Let’s get back to a doubtful user, who’s incriminating the microscope. The first thing to do is to discriminate if the issue is with the sample or the microscope.
We would therefore like to prove that the response in intensity is similar to the past one. For that, of course, we need a reference point in time, i.e. a value at t0. We recommend measuring the intensity response of your system just after an installation, a maintenance session, or a change of parts so that it can be a reliable “save-point” for future comparisons.
We recommend measuring the optical power at the sample location with a power meter, using the same illumination settings, to also have a “save point” for this metric.

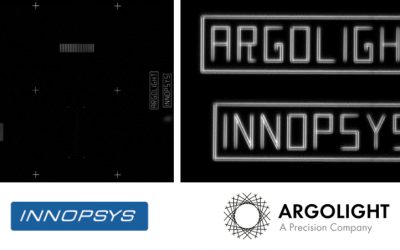
Image example of the 4×4 intensity gradation pattern.
In all the models of Argolight slides, an intensity gradation pattern is present that allows the analysis of the intensity response of a microscope. It is composed of 16 squares having different fluorescence intensity levels following a linear evolution. You can find the procedure and the acquisition recommendations here online in our knowledge center.
Let’s use this pattern to acquire a reference intensity response.
Step 1 – Acquire an image of the intensity gradation pattern
- Place your Argolight slide inside the slide holder. Start with a low mag objective (such as 10× or 20×). Set the DAPI (405 nm) or GFP (488 nm) channel. Make coincide the center of the slide with respect to the objective.
- Adjust focus through the eyepieces. Switch to the objective you would like to use.
- Move the slide to the 4×4 intensity gradation pattern. Do not zoom in on the pattern, as it’s a pattern sensitive to illumination power.
- Match the center of the pattern with the center of the field of view. Adjust the focus.
- Image the pattern by following the acquisition recommendations. For this test, we recommend acquiring a Z-stack multi-channel. To avoid saturation, use the range indicator provided in the acquisition software to define a suited exposure time.

Zen blue acquisition software (Zeiss) contains useful options (highlighted in red) to avoid overexposure.
- Save the image into a raw, non-compressed format (the best is the acquisition software proprietary format).
You can watch these steps from our video webinar, through the button below.
Step 2 – Define a reference intensity response
This image will be your reference image. To extract its intensity response and save it as reference intensity, launch Daybook Analysis software.
- Launch Daybook Analysis, select the type of slide you’re using.
- Select “Intensity response” in the “Select analysis” list.
- Upload your image(s) using the “Upload file” button.
- Select the image to be analyzed.
- Set the required and optional settings. If you’re using a Z-stack, tick the “Best focus selection” option.
- To proceed, click on “Start the analysis”.
- If needed, select a region of interest (ROI) and click on “Crop” to crop the image.
- After your analysis is finished, to save the current result as reference, click on “Save reference response”.
Step 3 – Compare your current response against a reference one
When a doubt arises on the intensity response of the microscope, acquire an image of the intensity gradation pattern, using the same acquisition settings as the reference image (objective, channel, exposure time, illumination power…).
Then, analyze this image in Daybook Analysis and compare it to the reference response previously saved. Only images with the same image dynamic range can be compared.
- Launch Daybook Analysis, select the type of slide you’re using.
- Select “Intensity response” in the “Select analysis” list.
- Upload your image(s) using the “Upload file” button.
- Select the image to be analyzed.
- Set the required and optional settings. If you’re using a Z-stack, tick the “Best focus selection” option. If there is a slight tilt on your image, tick the “Orientation correction” option.
- To proceed, click on “Start the analysis”.
- If needed, select a region of interest (ROI) and click on “Crop” to crop the image.
- After your analysis is finished, click on the “Compare response” button to compare your current result with the last reference intensity response saved.
A graph will show you the comparison of the two extracted intensity responses.

Results page within Daybook Analysis software, showing the comparison of two intensity responses. The two responses are matching.
3. What to do with the results?
If the intensity response is the same as the reference point, then the sample may be the cause of the issue. Congratulations, there is no major problem with your system.
If the intensity response is different, it means something in the microscope has fluctuated.
In this case, you can call after-sales services to request an intervention. It might also be interesting to investigate further when you’d like to reduce the downtime of the machine by pinpointing more precisely the source of the issue.
If you want to go further in the diagnostic, we recommend that you check the illumination path, as the illumination power is quite sensitive. This can be done using a power meter, such as the one we find on the Argo-Power. Use a power meter to measure the optical power at the sample location. It the optical power is the same as your “save-point”, then the issue comes from the detection path. If it is not the same, the issue comes from the illumination path.
You can check out our previous webinar to learn How to display live power measurement on your computer, using an Argo-POWERHM device.
The possible issues, coming either from the detection path or the illumination path, are listed non-exhaustively in the figure below.
To remember:
- An intensity response issue: detect there is an issue. The origin of the issue can either come from the detection path or the illumination path.
- A power measurement: Detect if there is an issue on the illumination path. If not, then the issue comes from the detection path.

Off you go!
It’s as simple as that. For more details on other cool ways to troubleshoot your microscope, or to operate your Argo-POWERHM, reach out to the Support Team and we’ll be happy to assist!
Header photo by Argolight
User case: Kyoto University x Argolight – Fluorescent proteins observation
Matsuda Lab, Graduate School of Biostudies/Graduate School of Medicine, Kyoto University Introducing Argolight slides - A New Quality Control...
Quality control of HCS-HTS fluorescence imaging systems
In the landscape of high-content screening (HCS) and high-throughput screening (HTS) fluorescence imaging systems, precision and reliability take...
Precision Partners: Innopsys and Argolight on the InnoQuant Slide Scanners
In the intricate realm of pathology, drug discovery, and advanced research in brain function, cancer, and stem cells, the role of slide scanners has...