How to measure resolution following ISO 21073 & early QUAREP-LIMI RECOMMeNDATIONS
with Argolight Daybook 3 Read
The Resolution Series
This post is part of a three-event series on PSF and resolution. First part is titled “Why do you do PSF : 3 Experts testimonies”, this is second part and the third part is a webinar demonstrating the new PSF features of Daybook 3.
You can already sign-up for the webinar here. and Subscribe to our newsletter here
In preparation of the new Point Spread Function (PSF) feature of Daybook 3 early March 2021,we had a look at the ISO 21073 about confocal microscopes and the early recommendations from QUAREP-LiMi members. We grouped those documents with our user guide to create a single source to perform PSF in accordance with those guidelines.
In December 2019, the International Organization for Standardization (ISO) published a standard for confocal microscopy: ISO 21073:2019 Confocal microscopes – Optical data of fluorescence confocal microscopes for biological imaging. As stated in its introduction, the scope of the document is to specify commonly used quantities regarding image performance in confocal laser scanning microscopy used for imaging of fluorescent biological specimens.
The document goes on offering definitions for: Resolution and strength of optical sectioning (4.1), Uniformity of field and centering accuracy (4.2), Co-registration accuracy (4.3), Stability of illumination (4.4) power and Field number of the confocal scan optic (4.5).
But if definitions are clearly stated, there are no described ways to obtain those quantities, and as all scientists know: protocols execution is a key for great data reproducibility.

Therefore, in early 2020, a group of enthusiastic light microscopists from academia, interested in improving quality assessment (QA) and quality control (QC) in light microscopy, decided to produce a document to complement the ISO 21073 and offer methodology. This document was published in November 2020 titled: Interpretation of Confocal ISO 21073: 2019 confocal microscopes: Optical data of fluorescence confocal microscopes for biological imaging- Recommended Methodology for Quality Control – Glyn Nelson, Laurent Gelman, Orestis Faklaris, Roland Nitschke & Alex Laude.
Eventually, to use their own words: “it became apparent that further work was required to determine best methodology and further minimal QC tests, as well as extend to other common imaging modalities”. This realization led to the creation of the Quality Assessment and Reproducibility for Instruments & Images in Light Microscopy (QUAREP-LiMi).

However, these early recommendations (not to be considered as official work of the QUAREP-LiMi, ulterior publications will supersede this document) are a great resource to complement ISO 21073:2019 Confocal microscopes – Optical data of fluorescence confocal microscopes for biological imaging.
For readability sake, we use “QUAREP-LiMi” instead of “Early recommendation from now-members of the QUAREP-LiMi” in the article. We will update this article as soon as QUAREP-LiMi publishes official guidelines.
Note from Argolight: QUAREP-LiMi group, now regroups more than 200 members across the world. Its first-of-a kind initiative is currently working on their first white papers. If you are interested in QA/QC, we strongly recommend our readers to visit Quarep-LiMi website and consider joining: https://quarep.org
A. What is resolution? Summary of the Resolution and strength of optical sectioning (4.1) part of the ISO 21073 Confocal microscopes – Optical data of fluorescence confocal microscopes for biological imaging.
The ISO 21073-2019 defines resolution as the full width at half maximum (FWHM) of the confocal PSF measured in the center of the object field. Lateral resolution being the FWHM of the intensity signal though the center of a point like object in the lateral direction. Axial resolution being the one in the axial direction.
B. What beads should I use for confocal PSF?
The size of the bead(s) should be sufficiently small to be considered a point-like structure. ISO 21073 & QUAREP-LiMi state that the beads should be smaller than half of the calculated theoretical resolution for the objectives / system.
The ISO 21073, in its Annex A, indicates a list of theoretical resolutions, calculated according to the vector numerical approach following the formulas of Richards and Wolf (Richards B., Wolf E., Electromagnetic Diffraction in Optical Systems. II. Structure of the Image Field in an Aplanatic System. Proc. R. Soc. Lond. A Math. Phys. Sci. 1959, 253 pp. 358–379).
QUAREP-LiMi states that for high end objectives, with NA > 1.2, this criterion requires beads smaller than 100 nm.
Note from Argolight: While proofreading this article, an expert noted that such small beads will hardly give you enough signal and suggest (as QUAREP does) to consider using gold nanobeads rather than fluorescent ones.
QUAREP-LiMi also remarks that focusing on small beads can be difficult, as such they advise that a more diluted volume of larger beads (e.g. 5um) can be added to small beads, to facilitate focusing (but not for the cPSF measurement, obviously).
C. How to mount beads for confocal PSF?
Comprehensive recommendations on how to produce calibration slide with beads for PSF (for SIM though) can be found in Demmerle J, Innocent C, North AJ, Ball G, Müller M, Miron E, Matsuda A, Dobbie IM, Markaki Y, Schermelleh L. Strategic and practical guidelines for successful structured illumination microscopy. Nat Protoc. 2017 May;12(5):988-1010. doi: 10.1038/nprot.2017.019. Epub 2017 Apr 13. PMID: 28406496.
In 2018, the French technological network for multidimensional fluorescence microscopies (RT-MFM) and its metrology group published a video step-by-step tutorial on how to mount beads (in English): https://youtu.be/ll4X_e8_mo8
The bead must be prepared to match the imaging conditions for which the objective was designed for: with/without a cover glass and in a mounting medium that matches the lens design.
Note from Argolight: While proofreading this article, an expert noted that the previous point will give you the best possible resolution with a given microscope and objective. However, if your goal is to determine the resolution achieved in biological samples, the actual biological sample mounting medium must be used, as well as when the PSF should be used for deconvolution.

Screenshot from the RT-MFM Video about how to mount beads. Credits : Metrology WorkGroup (GT 3M) of the RT-MFM, CNRS.
Both QUAREP-LiMi and ISO 21073:2019, state that for objectives designed for use with cover glass, the best beads are those that are mounted as close as possible to the cover glass as possible to minimize aberrations caused by the mounting medium.
QUAREP-LiMi, as well as our own exchanges with microscopists, stress that the drying time of the mounting medium must be respected to get good quality beads.
D. How to acquire image to obtain confocal PSF.

QUAREP-LIMI Logo (credit to QUAREP-LIMI 2021)
QUAREP-LiMi advises to find the focal plane of the beads and choose a field with relatively sparse distribution. But, because ISO 21073:2019 states that the resolution is measured in the center of the object field, and because experienced microscopists recommend measuring from 5 to 10 cPSF to get relevant values, ensure that you have a reasonable number of beads in the center area of your scanning field.
Both QUAREP-LiMi and ISO 21073:2019, state that lateral pixel size should be at least 10-fold smaller than the theoretical resolution. QUAREP-LiMi give the example of 1.4 – 1.45 NA oil lens at 520 nm, that gives a 160 nm theoretical resolution, meaning a <16 nm lateral pixel size.
The ISO 21073:2019 indicates that the scanned field should be at least 10-fold larger than the theoretical resolution (hence, 1.6 um for the QUAREP-LiMi example). This is for one bead. As QUAREP-LiMi points out, the scanned field can be increased around the center to get enough beads in one acquisition.
QUAREP-LiMi indicates that a maximum of 1 Airy unit pinhole should be employed, ensuring it is calculated at the same acquisition wavelength.
The ISO 21073:2019 remarks that for a non-circular pinhole, the largest dimension of such a pinhole shall not be more than 50% longer than the smallest dimension of the pinhole (for example, the diagonal of a square pinhole is 41% longer than its side).
Intensity wise, the resulting cPSF must display the full dynamic range down from the background noise to the brightest point. This prevents any clipping from impacting the measurement. The signal path should be linear: neither the fluorophore excitation, nor the detector shall be saturated.
E. The case of axial step for acquisition.
The ISO 21073:2019 does not specifically recommend an axial step for acquisition. However, the ISO states that:
““The pixel size shall be sufficiently smaller than the theoretical resolution, i.e. the pixel size should be at least 10-fold smaller than the theoretical resolution.”.
We think that this recommendation for pixel size can be seen as ambiguous and can either be understood as defining both the lateral and axial pixel size as 10-fold smaller than the theoretical resolution, or simply the lateral one.
The issue is that, experimentally, using such a small axial step could result in instant bleaching (if using a bleachable point-like-source).
In their early recommendation, the QUAREP-LiMi use the first definition, recommending an axial step that is 10-fold smaller than the theoretical axial resolution. But we have been made aware that current work in QUAREP-LiMi about axial step recommendation could depart from the broader ISO 21073 interpretation and recommend a larger axial step.
We will get in touch with the writer of the ISO standard to understand the “spirit” of the pixel size statement and clarify the condition of fulfillment (If some reader want to contact us with relevant information, please contact Argolight).
F. How to analyze Z-stack to get confocal FWHM from confocal PSF using Argolight Daybook 3.
ISO 21073:2019 states that the confocal FWHM shall be determined from the unprocessed recorded data (not deconvolved). A gaussian fit should be made for a single pixel width line profile laterally and axially through a bead from the center of the scanned field.
Many software are available to perform such analysis, many ImageJ-based macros and plugins (e.g., NoiSee, MetroloJ, ConfocalCheck, AutoQC, PSFj and MIPs) as well as standalone software / web application (Pycalibrate) (List from the QUAREP-LiMi white paper: QUAREP-LiMi: A community-driven initiative to establish guidelines for quality assessment and reproducibility for instruments and images in light microscopy).
Argolight offers such analysis as part of its free quality analysis software Daybook, here is a step-by-step process to apply ISO 21073:2019 and early QUAREP-LiMi recommendations:
- Launch Daybook 3, then Daybook Analysis – You need at least a Daybook Analysis version 1.7.3 to get the PSF option.
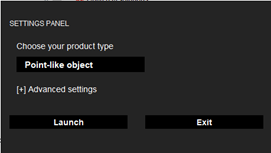
- Select “Point like object” in the setting panel.
- Select “Analysis” on the upper left corner of the screen.
- Select “Point spread function” in the “Select analysis” list (upper right corner of the screen).
![]()
- Upload your image(s) using the “Upload file” button. Once loaded, select any image in your Z-stack.
- In the settings selection the below options:
- Specified lateral pixel size (um): if the indicated value, extracted from the image metadata is not correct, input your correct value.
- Fitting function: select single gaussian.
- PSF processed ROI width (px): input 1.
- Background correction: leave unchecked.
- Hot Pixels removal: Removes the very intense (i.e. hot) pixels that may cause analysis issues. Check this option only if you have such hot pixels in the image.
- Specified axial pixel size (um): if the indicated value, extracted from the image metadata is not correct, input your correct value.
- Check “Best focus selection”
- Orientation correction: if you are aware of a tilt on the acquired images. Check “Orientation correction” and input the correction angle. The correction angle can also be obtained through the “Field distortion”, another available analysis of Daybook.
- Click on “Start the analysis”.
- Select within a region of interest (ROI) a single point-like object and click on “Crop” to crop the image.
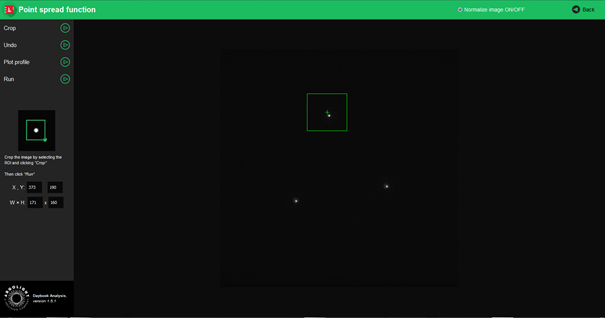
- Click on “Run”.
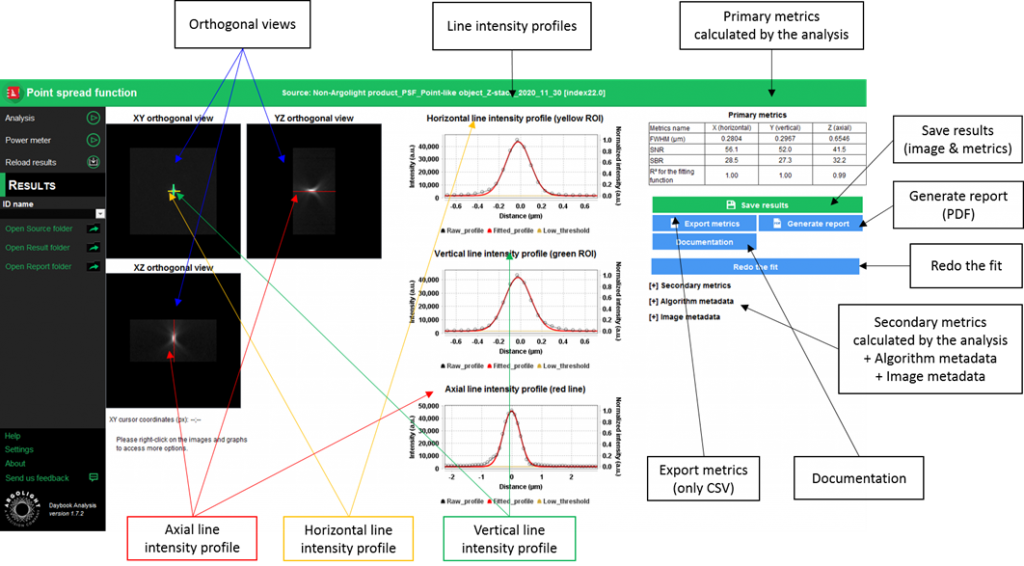
- After processing, Results are displayed in the form of images, maps, graphs, and tables.
- You can export results as a ready-to-print PDF, open CSV file, or if you purchased the Quality Control option of Daybook, save the data in the monitoring database.
G. How to report confocal FWHM to fulfill ISO 219073:2019 with Argolight Daybook 3.
The value of the cFWHM is stated in the “Primary metrics” table, for each point-like object both Axial and lateral FWHMs are indicated.
As stated before, most experts we interviewed perform from 5 to 10 beads analysis to get an averaged value of the confocal FWHM. However, they do not use the average (i.e mean) value of the confocal FWHMs measured. They exclude extreme values from the calculation: either discarding outlier values and averaging the remaining values or using the median value rather than the mean value of the cohort.
Neither ISO not QUAREP-LiMi issue recommendation about these approaches, but scientific method would dictate to explicitly mention the process used to get the final value, as well as relevant error bars.
ISO 21073:2019 states that the measured resolution (confocal FWHM) shall be declared together with other metadata: Excitation wavelength, detection wavelength band, manufacturer’s designation of the objective, size of detection pinhole in Airy unit and reference wavelength used for its calculation, polarization state of the excitation light, diameter of the point source, laser distribution in the objective pupil (normally uniform Gaussian) and a correlation coefficient for the goodness of fit for the gaussian curve.
At the exception of the last one (the correlation coefficient is expressed as R2 of the fitting function in the “Primary metrics” table) all those metadata must be sourced outside of Daybook.
Daybook 3 Troubleshooting new PSF feature will be available for free: easily and quickly measure FWHM on PSF Z-stacks.
Export values as CSV or ready to print reports. Upgrade for Daybook 3 Quality Control to get PSF value tracking, table, graphs, and value thresholds.

Ramona Optics
At Argolight, we believe that the real proof of a product’s impact comes from the people who use it every day. That’s why we invite our satisfied...

I3S
Microscopy is at the heart of countless biomedical discoveries—but how do you make sure the images you produce today are as reliable as those from...
User case: Kyoto University x Argolight – Fluorescent proteins observation
Matsuda Lab, Graduate School of Biostudies/Graduate School of Medicine, Kyoto University Introducing Argolight slides - A New Quality Control...