Matsuda Lab, Graduate School of Biostudies/Graduate School of Medicine, Kyoto University
Introducing Argolight slides – A New Quality Control Tool for Fluorescence Microscopy from Argolight
Argolight’s proprietary solution uses glass slides with embedded fluorescent patterns and an associated software to monitor the calibration of fluorescence systems. This unique offer has no similar existing products.
We spoke with Associate Professor Terai and doctoral student Mr. Watanabe from the Department of Frontier Life Sciences at Kyoto University, Japan to get their firsthand experience using Argolight slides.
Introduction to the Research Lab
| Users |
Associate Professor Kenta Terai, Department of Systems Biology, Graduate School of Life Sciences, Kyoto University (Now moved to the Institute of Biomedical Sciences, Tokushima University, Japan) Graduate Student Tetsuya Watanabe, Department of Medical Science, Graduate School of Medicine, Kyoto University |
| Affiliation | Graduate School of Life Sciences, Kyoto University – Department of Systems Biology/Department of Pathobiology and Medical Science Matsuda Laboratory |
| Research Theme | Aiming to discover “never seen before” phenomena using fluorescence bioimaging techniques, and to understand “various pathological conditions” using systems biology approaches |
| Lab Website | http://www.fret.lif.kyoto-u.ac.jp |
| Research Facilities |
Kyoto University Graduate School of Life Sciences Shared Research Facility for Life Dynamics Kyoto University |
Could you tell us about your research?
Associate Professor Terai: At the Matsuda Lab, we conduct “fluorescence bioimaging experiments using microscopes.
Fluorescent proteins, which label certain proteins to observe their movement, have been used since the late 1990s. Around 2000, FRET (Fluorescence Resonance Energy Transfer) emerged, enabling the detection of molecular interactions.
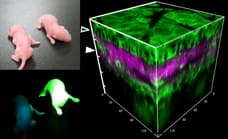
The Matsuda Lab started with cancer gene research and developed the world’s first fluorescent biosensor Raichu in 2001 to visualize cancer gene activity. By around 2010, we had created several dozen fluorescent biosensors.
Furthermore, we created transgenic mice expressing those biosensors, establishing a pioneering system to observe molecular activity in real-time within living organisms. With this technology, we aim to discover and understand never-seen-before phenomena.
We observe the biosensor within the transgenic mice using two-photon excitation microscopes, hence why fluorescence microscopes play a crucial role in our research.
At the Matsuda Lab, our educational curriculum includes studying microscopy-related concepts and learning to use microscopes proficiently. We are assigned a thick textbook of around 800 pages on microscopy. All lab members thoroughly read it to master concepts like wavelength, photons, waves, aberrations, N.A., as well as techniques such as confocal microscopy and image analysis. Acquiring this comprehensive microscopy knowledge is part of the lab’s curriculum.
Could you share any challenges or issues you’ve faced with microscopes?
Associate Professor Terai: One typical challenge is “confocal uniformity.”
It’s hard to tell if we’re imaging the same plane when observing irregularly shaped cells. Since cells are amorphous and we don’t observe standardized shapes, it was hard to tell how well we maintained the same plane. That’s a common example.
Another unresolved issue is “aberrations.” The causes could be spherical aberrations, uneven laser illumination, and various other factors. We wanted to be able to quantitatively demonstrate that the excitation light is not being uniformly illuminated.
The challenges with our microscopes
- Challenge 1: Flatness
- Challenge 2: Aberrations
- Challenge 3: Field non-uniformity
Right : One of Matsuda Lab’s microscopy room

How did you first learn about Argolight slides and start using them?
Associate Professor Terai: Professor Matsuda, the head of our lab, heard about this solution at some academic conference. He then asked me, “Why don’t we try out Argolight slides?” That’s how I became aware of its existence.
Both Professor Matsuda and our lab members have an eagerness to explore new technologies and tools. As per Professor Matsuda’s perspective, “When conducting cutting-edge research using state-of-the-art equipment, there is an inherent risk that the measurement results may not be accurate, so caution is necessary.” Our approach is to proactively try the latest equipment first, and then carefully evaluate whether it provides valuable capabilities, is unusable, or has issues that need to be addressed.
“Rigorously assessing new technologies is a key part of our work.”
Quality Control Tool: ARGOLIGHT SLIDE
The Argolight slides are quality control tools for monitoring and continuously managing the accuracy and quality of fluorescence imaging systems.
It’s easy to use – simply place the slide embedded with Argolight’s proprietary fluorescent patterns onto the microscope stage, and calibration begins immediately upon imaging. The captured fluorescent patterns can be analyzed using the dedicated Daybook analysis software, enabling image analysis of the patterns as well as continuous monitoring of the results.
No refrigeration is required for Argolight slides. They can be reused repeatedly over several years while maintaining stable fluorescence.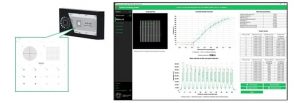
You previously mentioned some challenges like brightness issues. After actually using Argolight slides, could you share your impressions?
Mr. Watanabe: I’ve been finding it quite challenging to work in the longer wavelength range. In my research on FRET biosensors, I perform ratio imaging by observing two fluorescent colors, such as Cyan and Yellow, and inferring the activity state of molecules from the ratio of their fluorescence intensities.
Traditionally, shorter wavelength ranges like Cyan and Yellow were predominantly used. However, I’ve recently been working with longer wavelengths that I’ve developed, such as Orange and Far-red. A problem arises when the flatness of the fluorescence intensity across the field of view differs between these channels, causing the fluorescence intensity ratio to vary within the same field of view, which I would like to correct.
Unfortunately, with the Orange range (Ex: 546-566 nm, Em: 573-607 nm), even with maximum excitation light intensity and a 10-second exposure, I couldn’t detect any signal at all. With the same excitation settings, the Far-red range was barely visible.
Brightness Difference by Wavelength
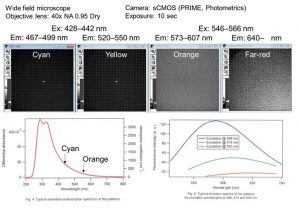
I wanted to perform corrections in the Orange-Far-red range but found it quite challenging. Looking at the Argolight slides manual, it seems that the Orange range has relatively weak absorption and low emission intensity/quantum yield. Do you think there is potential for improvement in this range in the future?
Argolight answer: The excitation wavelength range and emission spectra currently supported by Argolight slides are shown in the figure below. While the excitation wavelength range is 350-650 nm, a high-sensitivity sensor is required for fluorescence excitation at wavelengths longer than 550 nm. The current Argolight slides are the third-generation of products (AG03), offering approximately three times the brightness of the previous generation. We have received numerous requests from users for “brighter fluorescence” and the ability to “observe fluorescence in the longer wavelength range.” At Argolight, we are continuously working to improve the “brightness” issue.
Mr. Watanabe: To acquire images with an adequate signal-to-noise ratio in the Orange-Far-red wavelength ranges, a threefold increase in brightness may still be insufficient. I look forward to future research and development”.
Could you share with us some of the positive aspects you found while using Argolight slides?
Mr. Watanabe: The ability to quantitatively compare uniformity has been extremely helpful.
Surprisingly, we had been using a 60x NA 1.35 oil objective lens, thinking it was the best for our research. However, when we analyzed the uniformity, it turned out to be quite poor compared to lenses like the 40x NA 0.95 dry or 40x NA 1.4 oil objectives. The results quantitatively showed how much dimmer it was, whereas before we could only subjectively feel that it seemed dimmer.
“Being able to demonstrate the quantitative difference in brightness has been really beneficial.”
Installing the “ARGO-HM” on the Microscope Stage: Up until now, to assess uniformity, we observed solutions containing fluorescein (a type of fluorescent dye). However, with this method, there was significant interference from stray light outside the focal plane, which made it insufficient to confirm uniformity accurately. With Argolight slides, there is no such interference from stray light, which is a significant advantage.
So because there is minimal interference from stray light, you can accurately assess the uniformity, is that correct?
Yes, that’s right. We can accurately evaluate the uniformity. Uniformity can be compared “quantitatively”.
“Being able to accurately measure and compare what was previously ambiguous” – does this increase the reliability of the results presented in the research papers you publish?
Associate Professor Terai: I personally think so. In our research, we perform “ratio imaging”, but for example, when we take the ratio of two channels like GFP and YFP, if the flatness is different between the two, it actually happens that the ratio is smaller on the left side of the screen and larger on the right side. When the signal changes strongly this is fine, but this is only a slight variation, then the “difference in flatness” matters more.
Until now we could only detect things with high variations. But from now on, I think we may be able to track even slight changes with confidence. Being able to say something “with confidence” when we are doing experiments is extremely important.
If a salesperson can say “I can recommend this with confidence. Here is the basis for the confidence in my recommendation,” the buyer can view it positively. Similarly, if we can say “We have thoroughly investigated the quality and eliminated these possibilities,” then we can speak with confidence.
“It’s not just about having self-confidence, but for us scientists, being able to speak with confidence based on experiments and results is priceless and of immense value.”
Are there any other requests or expectations you would like to share for the future?
Associate Professor Terai: Personally, I would like something that can measure the PSF (point spread function).
Currently, are you measuring the PSF with beads?
Associate Professor Terai: Yes, the issue is that beads lack reproducibility in terms of brightness and size, so they are not very usable. Beads are described as having sizes like 5-6 μm or 800-900 nm, but not the exact measured value of 800 nm. So when measuring size, it’s just a rough estimate. Especially for two-photon or confocal microscopes, if we could measure the PSF in our lab, it would be helpful to notice if the PSF is blurring or becoming misaligned.
Thank you for your feedback !
Related Information
We are sharing information related to the fluorescence microscope quality control tool from Argolight that is being used by the Matsuda Lab in the Graduate School of Biostudies, Department of Integrated Biology/Graduate School of Medicine, Department of Pathology at Kyoto University, whose members kindly cooperated with this user interview.

Ramona Optics
At Argolight, we believe that the real proof of a product’s impact comes from the people who use it every day. That’s why we invite our satisfied...

I3S
Microscopy is at the heart of countless biomedical discoveries—but how do you make sure the images you produce today are as reliable as those from...
Quality control of HCS-HTS fluorescence imaging systems
In the landscape of high-content screening (HCS) and high-throughput screening (HTS) fluorescence imaging systems, precision and reliability take...